Crypto Funding Rate Report, September 2026: Hyperliquid Longs Paid the Most, LSK Shorts Paid 76%
Realised funding on 2,161 perpetual markets across Binance, Bybit, OKX, Bitget, Gate, MEXC, Hyperliquid and Aster in September 2026: who paid the most, the LSK and ONE squeezes, and the biggest cross-exchange funding carry trades.
 BTC
BTC ETH
ETH SOL
SOL HYPE
HYPE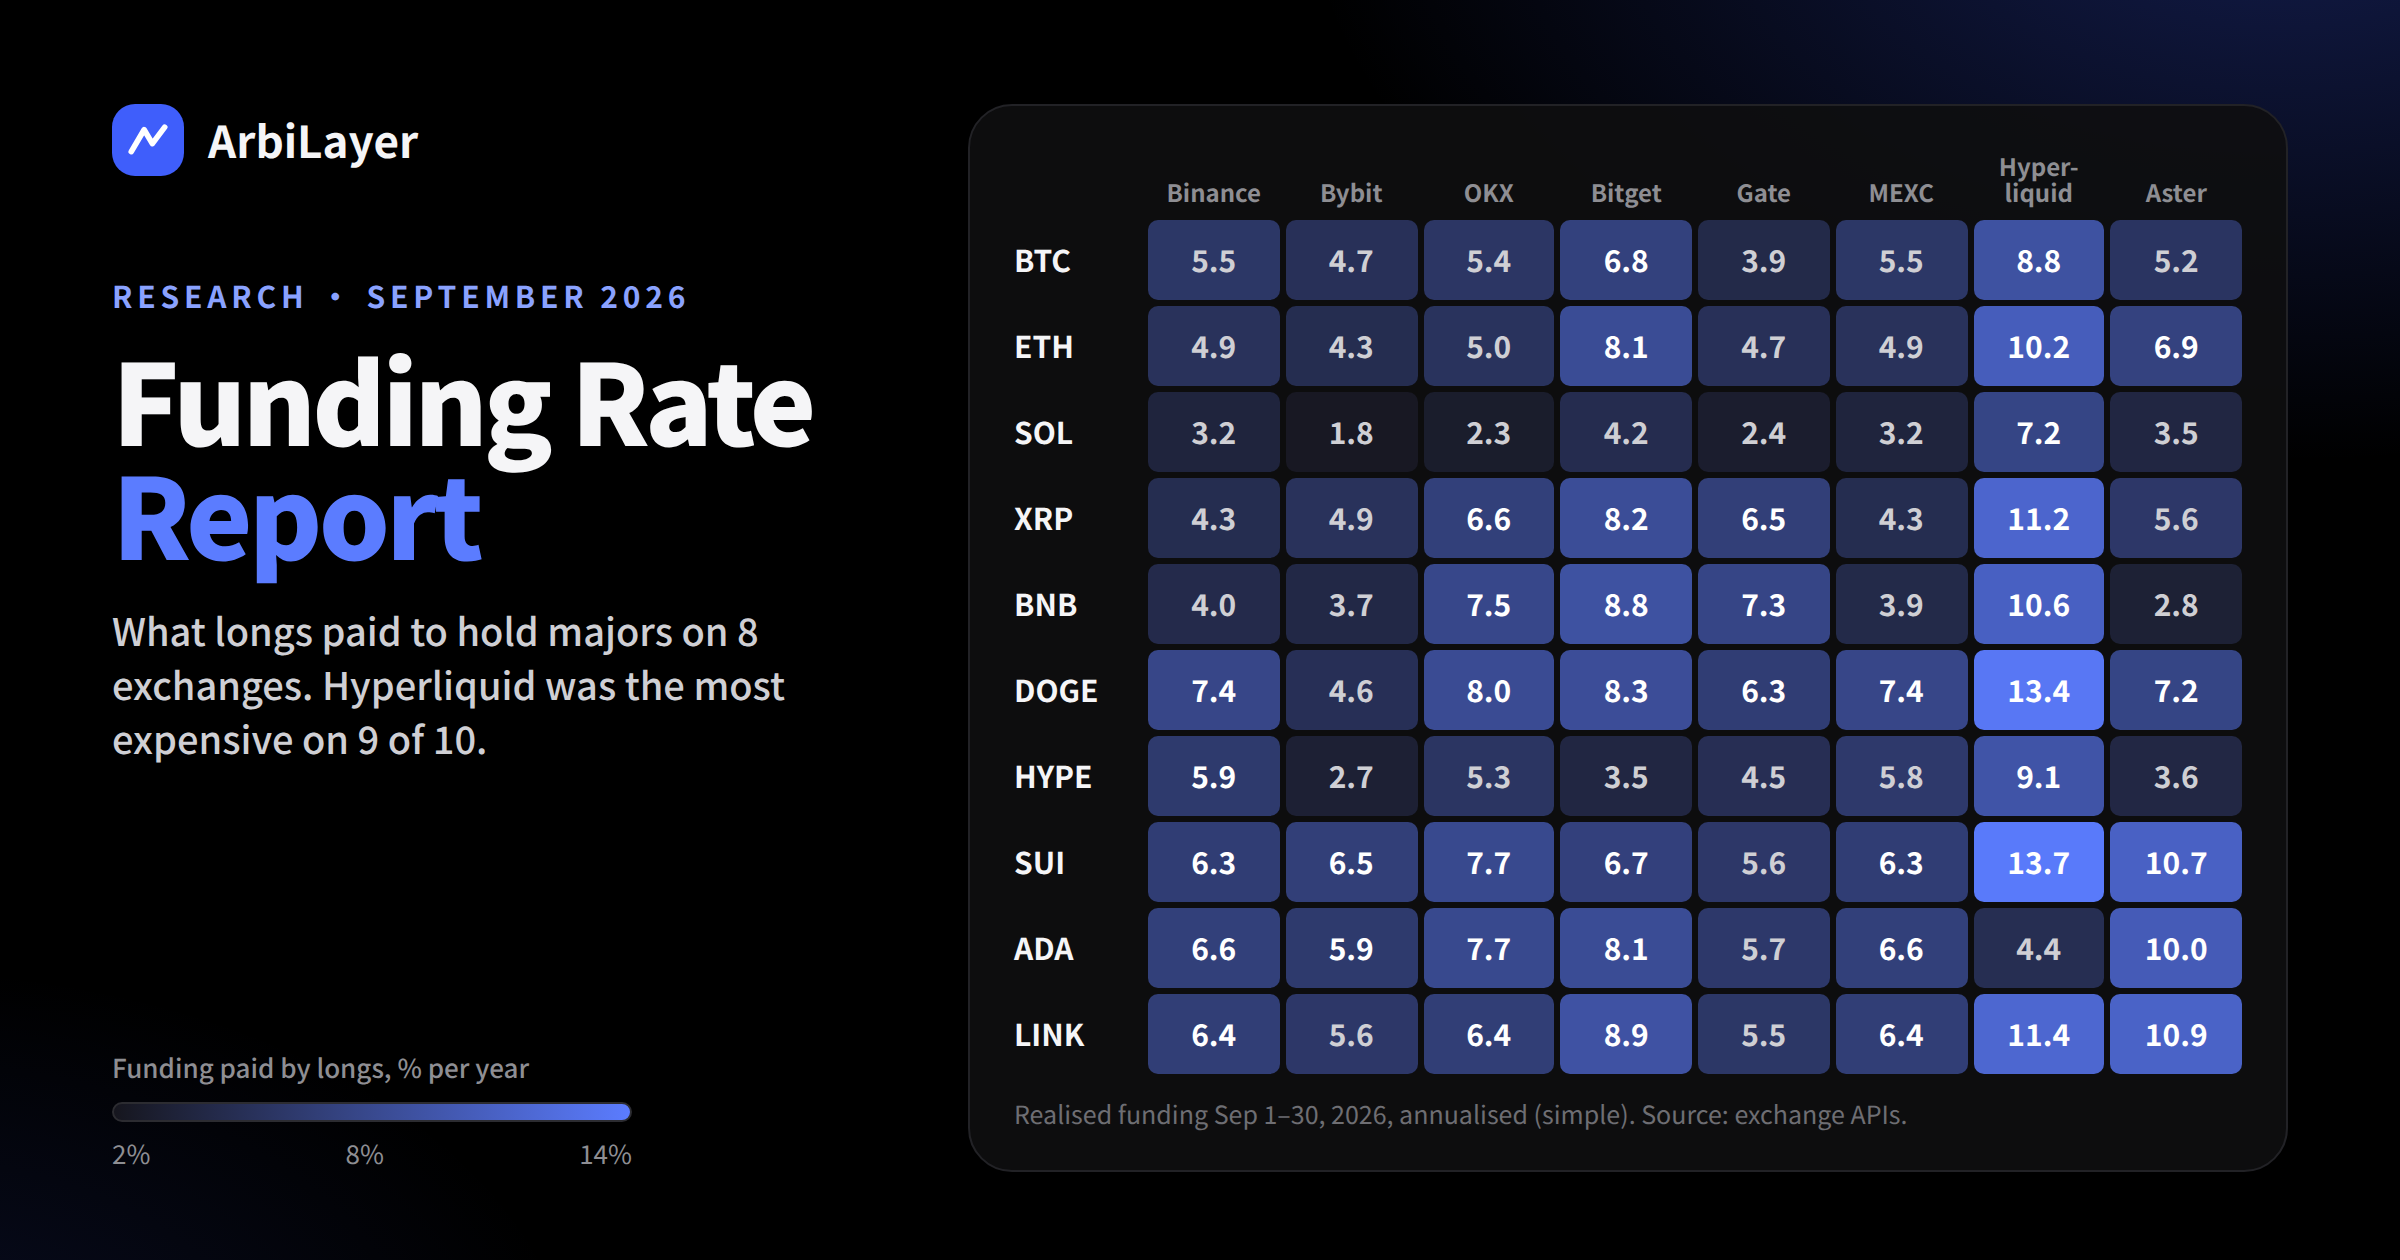
Funding is the price of leverage on a perpetual contract. When longs pay shorts, the market is paying to stay bullish; when shorts pay longs, the crowd is leaning the other way. Because every exchange sets its own rate, the same position can cost twice as much on one venue as on another — and the gap between venues is a trade in itself.
This is ArbiLayer's report for September 2026: the funding that was actually charged, not the live estimate, on eight venues and every liquid USDT perpetual they list.
How we measured
- Period: September 1–30, 2026, all settlements in UTC.
- Venues: Binance, Bybit, OKX, Bitget, Gate, MEXC, Hyperliquid and Aster.
- Coverage: 551 coins and 2,161 coin-venue funding histories, read from each exchange's public funding-history API.
- Monthly funding: the sum of every settled rate in the month. Positive means longs paid shorts. This works the same for 1-hour, 4-hour and 8-hour contracts, so venues are directly comparable.
- APR: monthly funding × 365 / 30, simple (not compounded).
- Liquid markets only for the rankings: a full month of history and at least $2M in daily volume on that venue.
Majors: what longs paid in September
Annualised funding paid by longs, by venue. The highest venue for each coin is in bold.
| Coin | Binance | Bybit | OKX | Bitget | Gate | MEXC | Hyperliquid | Aster |
|---|---|---|---|---|---|---|---|---|
| BTC | 5.5% | 4.7% | 5.4% | 6.8% | 3.9% | 5.5% | 8.8% | 5.2% |
| ETH | 4.9% | 4.3% | 5.0% | 8.1% | 4.7% | 4.9% | 10.2% | 6.9% |
| SOL | 3.2% | 1.8% | 2.3% | 4.2% | 2.4% | 3.2% | 7.2% | 3.5% |
| XRP | 4.3% | 4.9% | 6.6% | 8.2% | 6.5% | 4.3% | 11.2% | 5.6% |
| BNB | 4.0% | 3.7% | 7.5% | 8.8% | 7.3% | 3.9% | 10.6% | 2.8% |
| DOGE | 7.4% | 4.6% | 8.0% | 8.3% | 6.3% | 7.4% | 13.4% | 7.2% |
| HYPE | 5.9% | 2.7% | 5.3% | 3.5% | 4.5% | 5.8% | 9.1% | 3.6% |
| SUI | 6.3% | 6.5% | 7.7% | 6.7% | 5.6% | 6.3% | 13.7% | 10.7% |
| ADA | 6.6% | 5.9% | 7.7% | 8.1% | 5.7% | 6.6% | 4.4% | 10.0% |
| LINK | 6.4% | 5.6% | 6.4% | 8.9% | 5.5% | 6.4% | 11.4% | 10.9% |
Three things stand out.
Hyperliquid was the most expensive place to be long on nine of the ten majors. BTC longs paid 8.8% a year there against 3.9–6.8% on centralized exchanges, and on DOGE and SUI the gap was more than 5 percentage points. Hyperliquid settles funding every hour, and its premium held across the whole month rather than coming from a one-off spike. ADA was the only exception.
Bitget was consistently the most expensive centralized exchange — the highest centralized-exchange rate on eight of the ten coins.
The cheapest venue changes by coin. Bybit was the cheapest place to hold ETH, SOL, DOGE and HYPE longs, Gate for BTC, SUI and LINK. On SOL, Bybit longs paid 1.8% a year while Hyperliquid longs paid 7.2% — four times as much for the same exposure.
The whole market
Across all liquid perpetuals, the typical coin still had positive funding — longs paid all month on most venues:
| Venue | Liquid perps | Negative for the month | Median monthly funding |
|---|---|---|---|
| Hyperliquid | 57 | 3 (5%) | 1.16% |
| Binance | 335 | 48 (14%) | 0.76% |
| Bitget | 120 | 14 (12%) | 0.75% |
| MEXC | 100 | 9 (9%) | 0.60% |
| OKX | 156 | 20 (13%) | 0.55% |
| Bybit | 159 | 14 (9%) | 0.49% |
| Gate | 90 | 12 (13%) | 0.48% |
| Aster | 16 | 2 (13%) | 0.46% |
A median of 1.16% a month on Hyperliquid works out to about 14% a year — the cost of simply holding a leveraged long on the median coin there.
BTC funding stayed positive for almost the entire month. It dipped slightly below zero on several venues around September 5 and on a few days late in the month on Gate, OKX and Aster, while Hyperliquid's BTC rate never turned negative on any day.
One more detail: MEXC's daily BTC and ETH funding matched Binance's almost to the third decimal throughout the month.
Where longs paid the most
The highest monthly funding among liquid markets — mostly small caps where traders crowded into leveraged longs:
| Coin | Venue | September funding | APR |
|---|---|---|---|
| 龙虾 | Aster | 9.84% | 120% |
| AIN | Aster | 8.70% | 106% |
| ESPORTS | Binance | 7.90% | 96% |
| SIREN | Binance | 7.38% | 90% |
| AIN | Binance | 7.06% | 86% |
| BTW | Bybit | 6.81% | 83% |
| BTW | Binance | 6.76% | 82% |
| SPORTFUN | Binance | 6.27% | 76% |
| LYN | Binance | 5.72% | 70% |
AIN and BTW appear on several venues at once, which means the demand for leverage was market-wide, not a single exchange's quirk. Bitget's NATGAS contract also paid 7.5% for the month — a reminder that crypto exchanges now list commodity perpetuals with their own funding dynamics.
Where shorts paid the most
The other end of the table is far more extreme. Several of these markets hit the exchanges' funding floor of −2% per hour:
| Coin | Venue | September funding | Lowest single rate |
|---|---|---|---|
| LSK | Bybit | −75.99% | −2.00% |
| LSK | Binance | −67.61% | −2.00% |
| LSK | Bitget | −63.33% | −2.00% |
| ONE | Binance | −44.31% | −2.00% |
| ONE | MEXC | −44.26% | −2.00% |
| ONG | Binance | −35.92% | −1.16% |
| T | Binance | −32.13% | −2.00% |
| IOST | Binance | −28.08% | −2.00% |
LSK was the month's defining squeeze. After Lisk announced on August 25 that it would shut down its standalone chain on October 31 and proposed burning 100 million LSK, the token went through a series of violent short squeezes, including a run from about $0.14 to above $2.78 on September 12–13. Shorts holding LSK on Bybit for the whole of September paid 76% of their position in funding alone — before any loss on price.
ONE followed a similar path. Harmony announced on September 7 that it would wind down its Layer 1 and migrate ONE to an ERC-20 token on Ethereum, and deposits and withdrawals were paused on affected platforms. When the spot side cannot be moved between exchanges, shorts on perpetuals cannot be hedged or closed through arbitrage, and funding goes to the floor.
The pattern is the lesson: chain shutdowns, migrations and suspended deposits are when funding becomes a cost measured in tens of percent per month.
Funding carry: the biggest cross-venue gaps
A funding carry trade holds the same coin short on the venue that pays more and long on the venue that pays less. Price moves cancel out; what is left is the difference in funding. These were the widest gaps between liquid markets (at least $5M daily volume on both sides):
| Coin | Short on | Long on | Carry in September | APR | Days positive |
|---|---|---|---|---|---|
| 龙虾 | Aster | Gate | 7.89% | 96% | 29 / 30 |
| LYN | Binance | Bitget | 3.72% | 45% | 28 / 30 |
| ONE | Bitget | Binance | 3.55% | 43% | 23 / 30 |
| BR | Binance | Bybit | 3.53% | 43% | 26 / 30 |
| SOON | Bybit | OKX | 2.85% | 35% | 17 / 30 |
| USELESS | Bybit | OKX | 2.35% | 29% | 21 / 30 |
| GRASS | Hyperliquid | Bybit | 2.06% | 25% | 30 / 30 |
| AIN | Binance | Gate | 2.02% | 25% | 21 / 30 |
| MOVR | Gate | MEXC | 2.00% | 24% | 25 / 30 |
| GRAM | Hyperliquid | Bybit | 1.45% | 18% | 29 / 30 |
The headline APRs need context:
- Consistency matters more than size. GRASS earned on all 30 days and GRAM on 29 — the cleanest carries of the month. SOON was positive on only 17 days, so most of its return came from a few spikes.
- Tail risk is real. The ONE carry lost 0.8% of the position on its worst single day, in a market where deposits were frozen and one leg could be squeezed hard.
- Capacity is limited. The 龙虾 trade needed Aster's $8M-a-day market on one side. Larger size would have moved the very funding rate it was trying to collect.
- Costs come first. Four trading fees to open and close both legs, plus the spread, typically take 0.1–0.3% before any funding is earned.
For majors the carry is smaller but steadier: short BTC on Hyperliquid and long on Gate would have earned 0.40% in September (about 4.9% a year), and the same trade on ETH against Bybit about 0.48% (5.9% a year).
What this means for traders
- Where you hold a long matters as much as when. The same BTC long cost 3.9% a year on Gate and 8.8% on Hyperliquid in September.
- Hyperliquid carries a structural long premium. It is the most expensive venue for longs on most majors — and the most attractive short leg of a funding carry.
- Extreme negative funding is a warning, not an opportunity. LSK and ONE show what happens when spot cannot move freely: shorts paid tens of percent a month.
- Judge a carry trade by its worst day and its capacity, not by its APR.
ArbiLayer's funding page shows live and 30-day funding for any coin across these venues, and the arbitrage scanner finds the price gaps that come with them. We will publish this report every month.
Methodology note: funding is the sum of settled rates from each venue's public API between September 1 and 30, 2026 (UTC). Rankings include only markets with a full month of data and at least $2M in daily volume. Figures exclude trading fees, spreads and price risk, and are informational, not investment advice.
This article is for information only and is not investment advice.