Open Interest, Funding Rates, ADL and Liquidations Explained
What open interest tells you, how to read funding rates across exchanges, how liquidations and liquidation cascades work, and why auto-deleveraging can close a winning position, with examples and where to watch them live.
 BTC
BTC ETH
ETH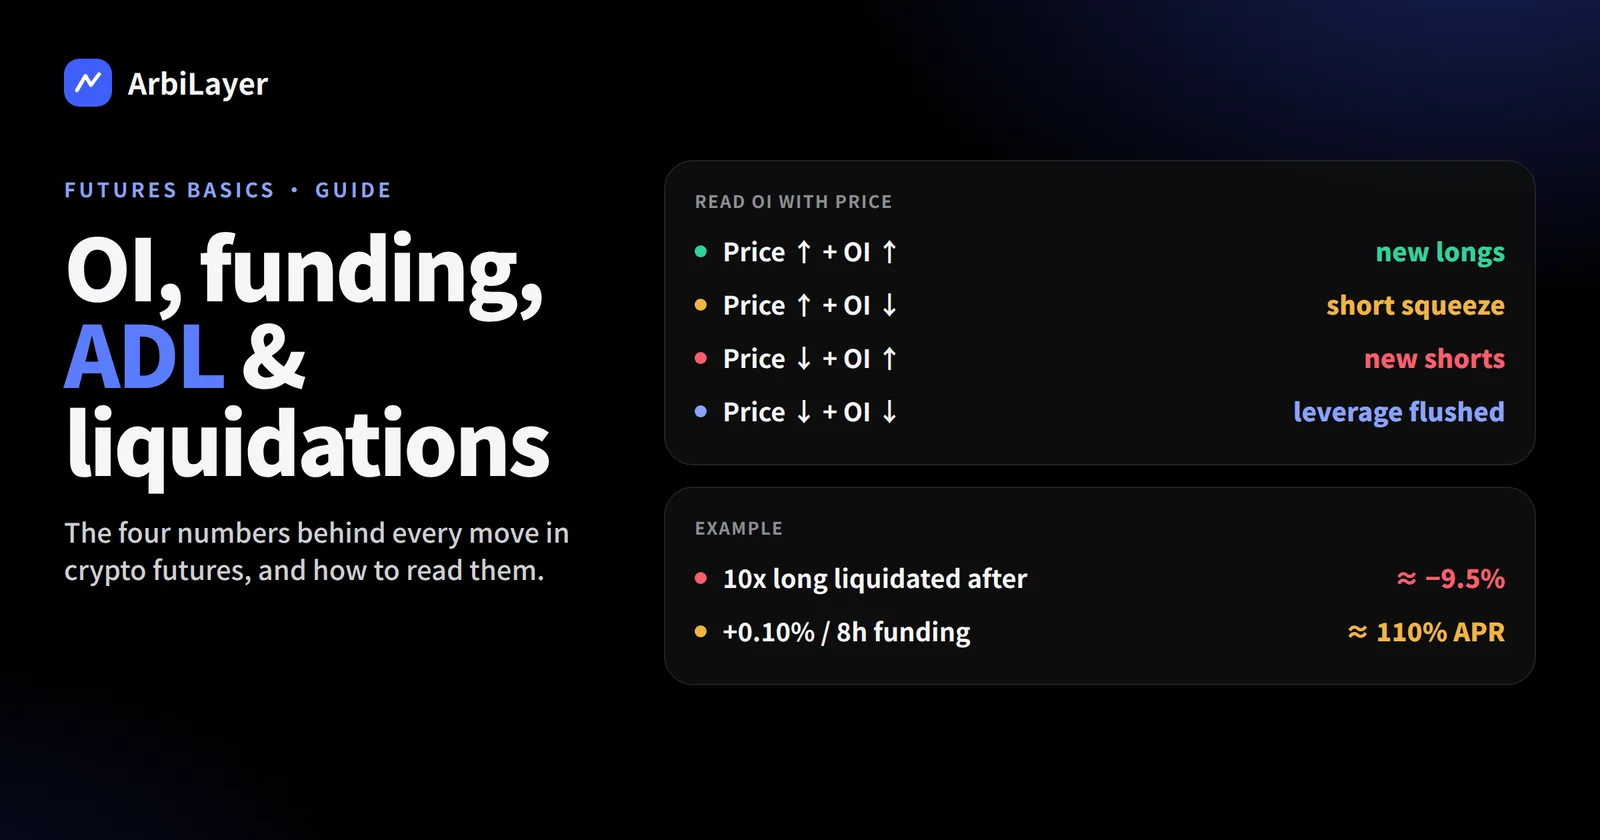
Open interest, funding rates, liquidations and auto-deleveraging (ADL) are the four numbers that explain most of what happens in crypto futures. They tell you how crowded a trade is, who is paying whom to keep it open, and why positions sometimes close without you touching them. This guide explains each one in plain terms, with examples, and shows where to watch them live on ArbiLayer.
Open interest: how much money is in the trade
Open interest (OI) is the total size of all futures positions that are still open. Every contract has a long and a short side, so OI counts each pair once. If you open a $10,000 long and someone else takes the other side, OI rises by $10,000. If a long closes by selling to a short who is also closing, OI falls.
OI is not volume. Volume counts every trade; OI counts the positions left standing. A coin can have huge volume and flat OI when traders are just passing positions back and forth.
Read OI together with price:
| Price | Open interest | What it usually means |
|---|---|---|
| Up | Up | New longs are entering: a trend with fresh money behind it |
| Up | Down | Shorts are closing (a short squeeze); the move can fade once they are out |
| Down | Up | New shorts are entering, or longs are averaging down |
| Down | Down | Longs are closing or being liquidated; selling pressure may be exhausting |
Very high OI relative to a coin's market cap or spot volume means the market is crowded and leverage is high. That is the setup for sharp moves in either direction, because liquidations feed on themselves.
Funding rate: the price of holding a perpetual
A perpetual future has no expiry date, so something has to keep its price close to the spot price. That something is the funding rate: a payment between longs and shorts every few hours.
- Positive funding: the perp trades above spot, so longs pay shorts.
- Negative funding: the perp trades below spot, so shorts pay longs.
The payment is the rate times your position size. At +0.01% per 8 hours, a $10,000 long pays $1 every 8 hours, about $3 a day. At +0.10% per 8 hours it pays $30 a day, which is 110% a year: that is what an overheated market looks like.
Compare rates on the same clock. Exchanges settle funding every 1, 4 or 8 hours. A 0.01% rate every hour is eight times more than 0.01% every 8 hours. ArbiLayer's funding page normalises every rate to 24 hours and to APR so you can compare them directly, and shows each venue's interval and countdown to the next payment.
How to read funding:
- Slightly positive (around 0.01% per 8h) is the normal state: most markets lean long.
- Strongly positive across many exchanges means longs are crowded and paying heavily to stay in. A drop can trigger a long squeeze.
- Strongly negative means shorts are crowded. Short squeezes start here.
- Different rates on different exchanges for the same coin are an opportunity: you can short where funding is high and long where it is low. That is funding rate arbitrage.
Liquidations: when the exchange closes your position
When you trade with leverage you put up margin, a fraction of the position size. If the price moves against you and your margin falls below the maintenance margin (a small percentage of the position, often around 0.5% for large coins and more for small ones), the exchange closes the position. That is a liquidation.
A simple example: you open a 1 BTC long at $60,000 with 10x leverage, so your margin is $6,000. With a 0.5% maintenance margin ($300), the position is liquidated when your loss reaches about $5,700, which happens near $54,300, roughly a 9.5% drop. At 20x the same position would be liquidated after a drop of under 5%. Fees and funding move the exact price a little.
Three details matter in practice:
- Mark price, not last price. Exchanges liquidate on a mark price built from an index of several spot exchanges, so a single wick on one venue does not wipe everyone out. It also means two exchanges can liquidate the same position at different prices. We explained why in why two exchanges can liquidate the same position at different prices.
- Cascades. A liquidation is a forced market order. In a crowded market each liquidation pushes the price further, triggering the next one. This is why high open interest and extreme funding often end in a violent move.
- Insurance fund. If a position is closed at a worse price than its bankruptcy price, the exchange's insurance fund covers the gap so the winning side still gets paid.
ADL: when the insurance fund is not enough
Auto-deleveraging (ADL) is the last line of defence. If liquidations happen so fast that the insurance fund cannot absorb the losses, the exchange closes positions on the winning side to balance the books. Your profitable position is closed automatically at the bankruptcy price of a liquidated trader.
Who gets deleveraged first? Exchanges rank traders on the profitable side by a mix of unrealised profit and leverage: the most profitable, most leveraged positions are first in line. Most exchanges show this as an ADL indicator, usually five lights or a percentile next to your position.
ADL is rare on large coins and more common on small caps, new listings and perp DEXs during extreme moves. To lower your risk:
- Use lower leverage on winning trades, and take partial profits in fast markets.
- Watch the ADL indicator: if it is at the top, you are first in the queue.
- Be careful with thin markets: new perps and low-liquidity coins have small insurance funds.
Putting it together
The four numbers work as a set:
- Open interest tells you how much leverage is in the market.
- Funding tells you which side is crowded and how much it costs to stay.
- Liquidation levels tell you where forced selling or buying will start.
- ADL tells you that even a winning trade can be closed for you when things break.
A rally with rising OI and moderate funding is healthy. A rally with rising OI and extreme positive funding is fragile. A crash with collapsing OI is often a flush that clears leverage out.
Where to watch these numbers on ArbiLayer
- Funding rates for every coin: live, normalised to 24h and APR, with the biggest gaps between exchanges.
- Per-coin funding pages, for example BTC or SOL.
- Arbitrage scanner: price spreads with funding for both legs, including 30-day funding.
- Lowest futures fees: fees decide whether a leveraged trade or a funding trade is worth it.
This article is educational and is not investment advice. Leveraged trading can lose more than your initial margin.
This article is for information only and is not investment advice.